One of the main responsibilities of a project manager is to ensure that the project is completed within planned budget and schedule. To ensure this kind of firm control, you will first need to track how a project is moving in terms of cost and timeline.
There are several tools which are used by project engineers to track how a project is moving. Earned value project management has to be one of the most important ones.
Earned Value Definition
For any task or project, the earned value refers to actual work done or actual progress achieved for that task/project. This actual value of work done can be represented in terms of % value or in absolute units.
For example, a construction task requires the erection of 50 columns on the site. So far the team has done 10 columns. So the earned value in absolute terms is – 10 columns and percentage terms – 20% (10/50).
So if you look past the fancy name “Earned Value Management”, what this method really means is – track the actual work that has been done and check how it compares with what needed to be done.
Tracking of Actual Work
With this simplified definition, you need two things for earned value analysis of your project –
- Amount of work that has been done
- Amount of work that needed to be done (planned)
The planned work part is easily available from the project schedule. But it takes more effort and communication, to regularly keep track of actual work being done.
Difficulties in tracking earned value (actual work done)
There are several reasons for why the actual work tracking is not as easy –
- Teams are distributed – Project engineer is in office and construction team is on site.
- Tasks are not well defined – The site team will not know what to report if they are not properly instructed about what needs to be tracked. If the scope of work is not well defined, then it becomes difficult for site team to convey detailed information about the amount of work done even when it has already been done.
- Lack of direct communication – Site engineers often send updates and reports to the project management office on weekly/monthly basis via emails, transmittals etc.
- Manually translating site data to reports – Even after the project engineer receives data from site, he has to spend time to process that raw data and put it in easily readable formats such as Gantt chart or S-Curve etc.
Seemingly most of these difficulties in tracking the actual work are originating from communication gaps. Fortunately, these gaps can be effectively bridged with a proper document management and project management platform.
With a proper communication platform in place, a project engineer will be well equipped to track the actual work in terms of two important parameters –
- Actual project progress (timeline of actual work done)
- Actual project cost (money or manpower resources spent)
This progress and cost timeline data is then used to determine other important numbers –
- Schedule Variance (SV)
- Cost Variance (CV)
- Schedule Performance Index (SPI)
- Cost Performance Index (CPI)
Calculating Earned Value at Project Level
The actual work done and actual spending can be tracked at task level. And when you put those progress and cost numbers into earned value method, it will tell you the complete story at individual task level.
But how does that task level data then translate into a complete picture for the overall project?
The simplest way to calculate earned value at project level would be to use the average earned value of all the tasks. But that would not be completely correct.
Some tasks need significantly more work than others. So their progress should contribute more to the overall project progress than other tasks.
For example, compare two construction tasks –
- Task A: building 100 piles in area A
- Task B: building 20 piles in area B
20% completion of Task A = 20 piles
80% completion of Task B = 16 piles
So the tasks are not equal. Then how do you average them?
The answer is to take a weighted average of their percentage earned value, using their scope of work as task weights. So in our example from above, the number of piles to be built would serve as the weights for calculation of project level earned value.
Weighted Average of Earned Value for task A & B = (20%×100 + 80%×20) / (100+20) = 30%
So the weighted average earned value turns out to be 30% instead of mean average 50%. This makes good sense considering that the heavier task A is only 20% complete.
A general equation for project level earned value is –

Where, EVi = Earned Value of Task i
Wi = Weight of Task i
Earned value based reports
The earned value calculated at task or project level is useful only if its meaning can be well understood with different reports.
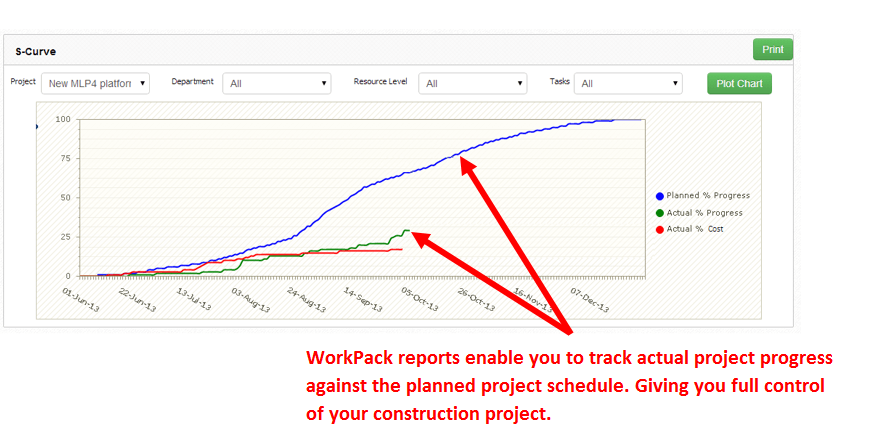
One of the commonly used graphical report based on earned value analysis is the project S-Curve. Typically an S-Curve compares three things –
- Planned Curve – Planned trajectory of the cumulative project progress (which in the ideal world of a project plan overlaps with trajectory of project spending/planned costs)
- Actual Progress Curve – Timeline trajectory of the earned value
- Actual Progress Curve – Timeline trajectory of the actual costs
You can either create S-curve report using excel sheets or you can use a project management software. WorkPack is a project and document management platform used by many engineering & construction companies to integrate different aspects of their projects – documents, drawings, construction, purchase, logistics etc. WorkPack puts the progress of all these areas of a project together in a nice looking auto-generated S-Curve report.

So you can relax and let WorkPack handle the reporting chores. Find out what else WorkPack can do for your team.
If it looks interesting, create a free account to try your hands on it. Let us know in case you have any feedback or questions for us.
No Comments