Engineering & construction projects are quite complex by their very nature. A project manager in charge of engineering & construction is responsible for managing this complexity and keep the project timeline and costs under control.
Before you can manage project timelines, you first need to create a project schedule. This schedule should capture the timeline of all important activities and milestones.
Afterwards, you will need to track the actual timeline of these activities, milestones and update the same in the project schedule. This way you can even forecast when the project can realistically finish, considering the actual rate of progress.
Your project team will refer to this schedule time and again to understand what they need to work on in the coming days and weeks.
Managers will check on the schedule to make sure that the work is progressing as planned. They will also try to identify if there are any possible delays or problems brewing.
As a project manager, you will also need to compare the actual project timeline with the planned timeline, identify delays, forecast their impact and take proactive measures to minimize time loss.
So you can see that a project schedule is quite an important piece of the whole project management effort.
Now let’s try to understand some basic concepts regarding the project schedule.
Gantt chart
Most commonly, schedule of engineering and construction projects is prepared using Gantt chart format. To put it simply, a Gantt chart is a graphical report representing timelines of different project activities.
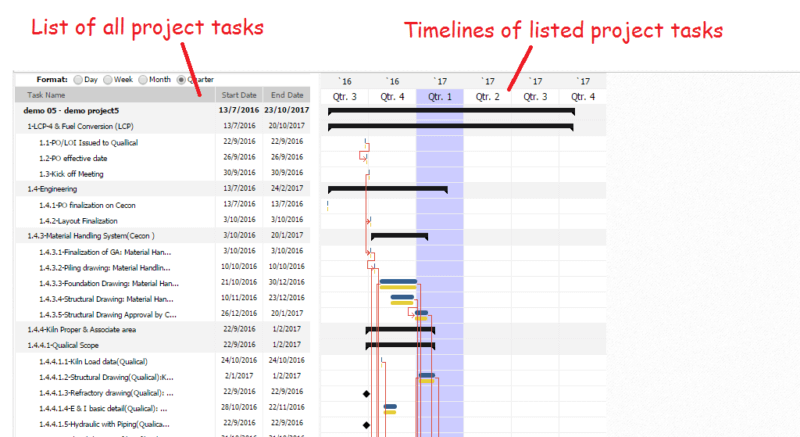
A Gantt chart has two main areas. Area on the left lists all the project activities included in the project schedule.
On the right, horizontal bars represent the timelines of those activities. Horizontal axis represents timeline or dates. Each bar is drawn from the start date of an activity to its end date.
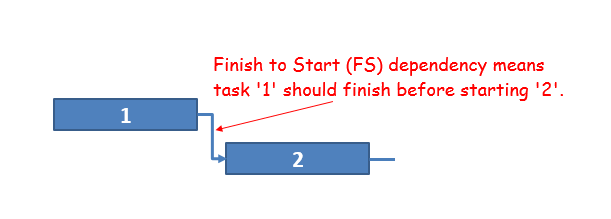
Sometimes you will also see two or more bars connected to each other with arrows. These arrow linkages are ‘dependency relationships’ between activities. Simply meaning that the second activity will start only after the first activity is completed. This is the most commonly used ‘Finish to Start’ type of dependency.
But there are also some other variations of dependency relationships.
Different types of activities on Gantt chart
But all the listed activities or tasks in the left column of Gantt chart are not alike. There are some special types of tasks in a Gantt chart.
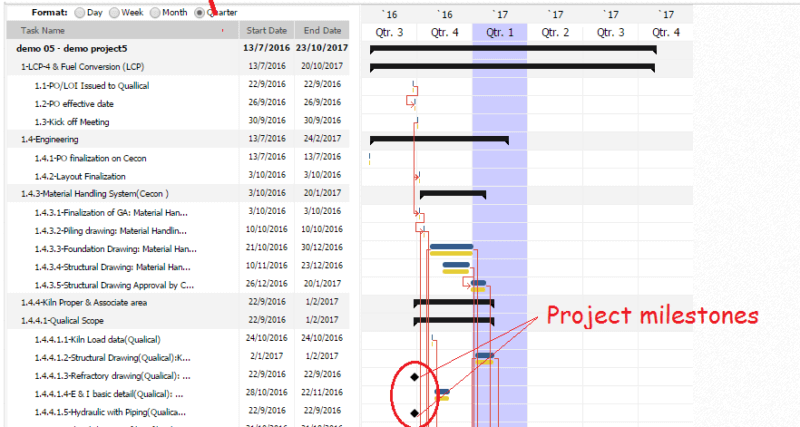
Milestones
Milestones are key events in a project. Since it is an event and not a task, it starts and ends on the same date. And normally a project milestone is represented in the shape of a ‘black diamond’ on a Gantt chart.
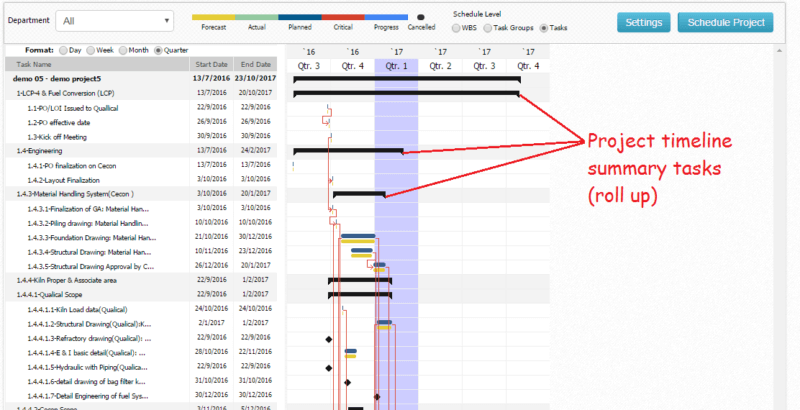
Summary Tasks
Summary tasks are used for representing the summarized timeline for a bunch of different tasks. A summary task is like an umbrella stretching over a bunch of tasks.
For example, if 5 tasks in a schedule are captured in a summary task, then the earliest start date out of those 5 tasks will become the start date for the summary task. Similarly, the latest end date will be the end date for summary task.
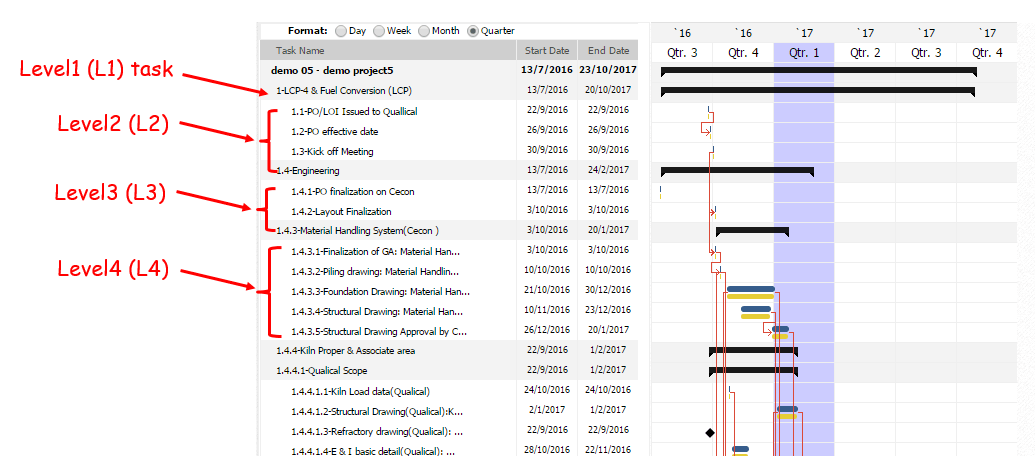
Parent Tasks & Subtasks
A bunch of tasks can also be grouped under a parent task. This kind of grouping makes it easier to manage the entire scope of works at different levels.
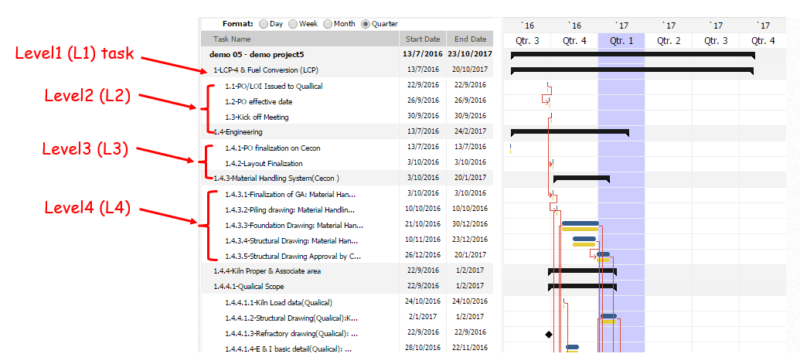
Normally the highest level of tasks is referred to as L1. The next level of subtasks is L2 and so on. The number of levels to be used depends on the complexity of the project.
More complex projects tend to have multiple levels of tasks, so it becomes easier for the project manager to track the schedule at a high level and drill down to deeper levels only in case there is any issue.
When managing different projects from a portfolio, L0 is also used to represent the timelines of different projects on the same bar chart.
Understanding Float in a project path
Project schedule consists of different chains of tasks which are linked together by dependency relationships. These chains are also referred to as ‘paths’.
The ‘Float’ in any of these chains represents the buffer for delays in that chain. If any task in that chain can be delayed by ‘x’ days without delaying the whole project, then that chain has ‘x’ days of positive float.
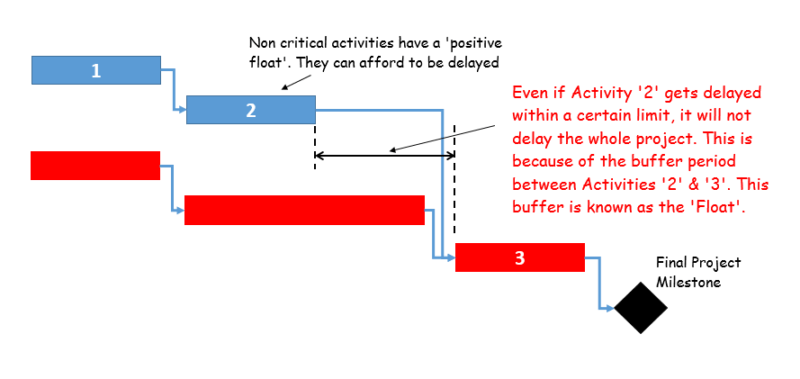
Consider the image above for example. The chain (or path) of tasks highlighted in blue has some buffer period between tasks 2 and 3. So even if tasks 1 or 2 get delayed by a little bit, it won’t immediately hamper the final project completion milestone.
Critical Path
Some of these project paths or chains have zero float value. This means that there is absolutely no margin for any delay. All the tasks are so tightly bound to each other that even one day of delay will delay the whole project by a day.
All tasks in that chain are then critical for timely execution of the project.
Hence such chains of tasks are labeled as the ‘Critical Paths’. These are normally the longest chains in the project schedule.
There can be one or more critical path in a project schedule.
From the example above, if any task from the red chain gets delayed by even a day, final project milestone will definitely be delayed. Hence all the red chain tasks are critical and red chain itself is the ‘Critical Path’.
Critical Path Method for Scheduling
The critical path method (CPM) for scheduling a project uses this concept of critical path. This scheduling algorithm is widely used for scheduling engineering & construction projects.
In this method, first different chains of tasks are listed, linked together by dependency relationships. Then the critical path is identified out of all these chains. Finally, all tasks are scheduled to respect the dependency relationships.
The tasks get lined up one after another according to their dependencies. The resulting chain of critical tasks forms the longest chain. In other words, it is the shortest possible duration in which project can be completed, since it is not possible to reduce the critical path duration any further.
If you fix the target end date of project completion. This method will give you the latest possible date for starting a project, based on the critical path. If the project is started after this date, finish date cannot be met.
Project Baseline
Project baseline is used as a reference timeline of the original project schedule during the course of the project.
When the project schedule is first created, it is free from any effect of delays.
But when the actual work starts, some project work gets delayed. Sometimes scope of work changes. Or even the availability of resources can change.
All these factors will impact the project schedule and have to be accounted for in the project schedule.
So the project schedule gets updated multiple times during the course of the project and the overall timeline changes each time.
But it is important to track these changes against the originally intended schedule. This is made possible by the project baseline.
You can save multiple project schedule baselines to capture a memory snapshot of the schedule at that point in time.
Later comparison of baselines will tell you how the schedule has evolved.
Scheduling Software
Most scheduling software packages use the ‘Critical Path Method’ for creating the project Gantt chart.
MS Projects and Primavera have traditionally been the popular software packages for engineering and construction project managers.
Some project managers have also used basic MS Excel spreadsheets for creating a project Gantt chart.
But there is a problem with these tools – the schedule from MS Project, MS Excel or Primavera cannot directly connect with actual project work and track actual progress on the same Gantt chart.
Tracking the project schedule
Even after creating a project schedule, it will not help you much if you are not regularly tracking actual progress against this scheduled timeline.
Normally in case of engineering & construction projects, the actual work is largely disconnected from the project schedule.
Manual Progress Tracking
To track the actual progress achieved by your team, you can either manually get the progress inputs from them, put them in an Excel sheet or enter them in your scheduling software.
This will take significant time and energy. But even sophisticated software packages like MS Projects or Primavera have little ability to directly track actual progress achieved in engineering & construction project activities.
Integrate Schedule & Progress Tracking
You project schedule from MS Project or Primavera is already available in a digital format.
Additionally, what we want is to capture actual progress information in digital effort with minimal efforts.
You can further note that most of your project work is captured in –
- A bunch of files – documents, drawings, POs, Contracts, Permission etc.
- Different spreadsheets (for tracking material costs, inventory, construction progress etc.)
- Project related communication largely captured in emails
So if your project schedule is connected with document management, emails and spreadsheets used by your team, it makes it easier track their work against the project schedule.
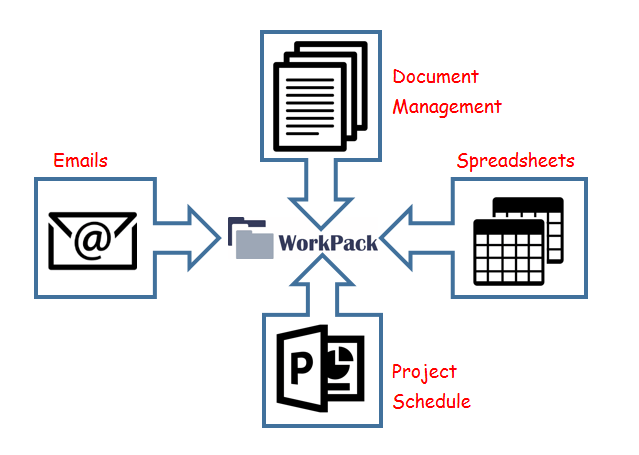
WorkPack does exactly that to connect project schedule, document management, emails and spreadsheets on a single platform. This way you can automate the progress tracking for engineering & construction projects.
WorkPack has already helped project managers from different industries to track the progress of their engineering and construction projects.
Do you think it can help your project team as well? Find out by creating a free account.
Let us know in case you need any help to set up this free account or if you would like to schedule an online demo session for your team.
No Comments