Construction projects are quite complex by their very nature. A project schedule usually helps in simplifying this complexity and making sense of the overall scope of work.
Project schedules are commonly prepared for projects of all sizes. But for larger and more complex projects, this scheduling becomes very important.
There are a few methodologies for scheduling a project. Following two are very well know and popular among project managers from different industries –
- Program Evaluation Review Technique (PERT)
- Critical Path Method (CPM)
Gantt chart
Gantt chart is probably the most popular scheduling tool among project managers. It is a chart depicting timelines of all the project activities – represented by horizontal bars.
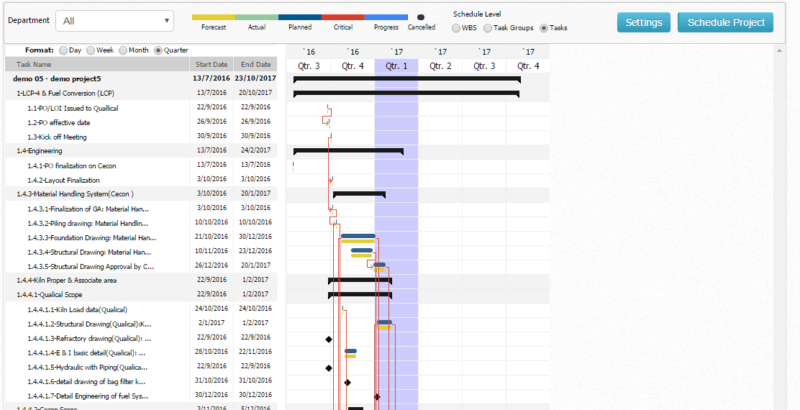
Usually Gantt charts are developed following the critical path method for project scheduling.
Critical Path Method
‘Critical Path Method’ for scheduling a project relies on identifying a chain of project activities which have direct influence on the overall project timeline. This chain (or path) of activities is also known as a critical path.
A critical path on a Gantt chart is normally a chain of tasks that are bound together so tightly, that even an increase of 1 day in duration of any of those tasks will result in 1 day increase in the overall project timeline.
But, that is a very qualitative explanation of what a critical path is. This qualitative definition will work when we are working with a limited number of tasks and project manager can examine each chain of activities to find the critical path.
But when you have thousands of activities to be scheduled for a construction project, you need a quantitative definition that helps in quick analysis of a critical path.
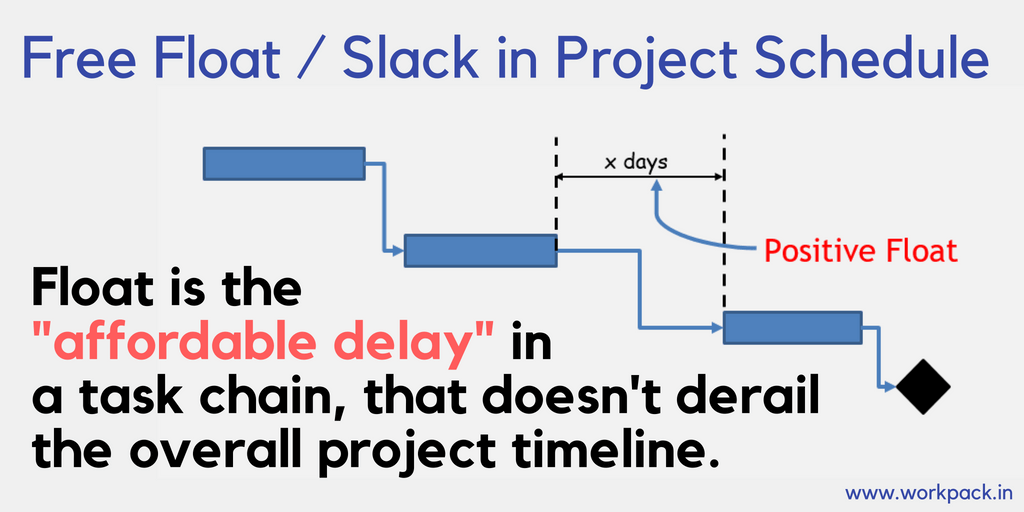
That is where the concept of ‘schedule float’ or ‘schedule slack’ comes in.
Project schedule float or slack
On a Gantt chart you can see different project activities connected to each other by ‘dependency relationships’. These linkages between tasks result in multiple chains of tasks in a project Gantt chart.
Some of these chains may even be interconnected to each other.
Concept of a float refers to ‘excess’ or ‘buffer’ time within a chain – over the collective duration of all the tasks in that chain.
For example, consider the following scenario –
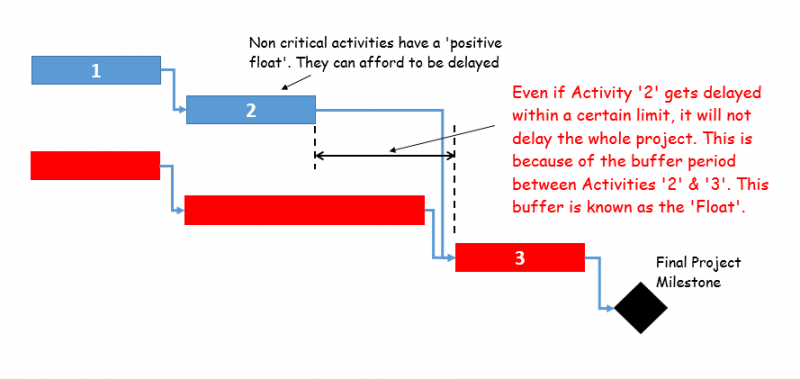
In ‘Task Chain 1’ consisting of tasks 1, 2 & 3, there is some gap between tasks 2 & 3. Let’s say that gap is of ‘X’ days.
So even in case task 2 gets delayed by a few days, that delay will not impact any other task or the final project milestone, as long as the delay is less than X days.
In this case, X number of days is the positive float for ‘Task Chain 1’.
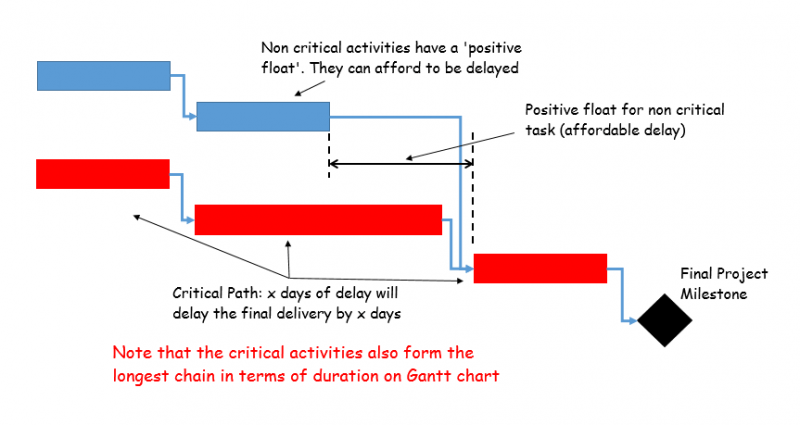
On the contrary, there is no such gap between any tasks of the second task chain (highlighted in red). As there is no excess or buffer period in this chain, the total positive float is zero.
So, if any task in the second chain gets delayed by even one day, the final project milestone will be delayed by a day.

That is how ‘schedule float’ concept helps us identify the critical path in a very quantitative way –
One or more task chains with zero float represent the critical paths in that Gantt chart.
Importance of schedule float or slack
Float in each chain of tasks can be objectively measured and quantified to a single number.
Hence, when dealing with thousands of tasks in a complex construction project schedule, this method is helpful. One can even use a scheduling software to quickly calculate the float for multiple task chains.
Then, the chains having zero float will be identified as critical paths. Usually, the longest task chain is gets identified as the critical path and the total duration of this critical path corresponds to the project duration.
This is how schedule float / slack concept has simplified the critical path method and quantified the critical path concept so that a scheduling software can quickly create a Gantt chart, using schedule float numbers.
No Comments