As a project manager, one of the main things that you need to do is to ensure that your project is completed within budget and on schedule. To achieve this, you will need firm control over the project progress and spending. And to maintain such firm control you first need to have very clear visibility of –
- How your project is progressing with time
- How much you are spending to achieve that progress
One of the best tools that a project manager can use to have this clear visibility is Earned Value Management. Basically, the term “Earned Value” represents the amount of actual work done in a project. This earned value can be written in different units.
When you calculate the earned value in dollar terms, you can directly compare it with project spending and determine how cost effective your project execution has been.
If you calculate the earned value in terms of number of mandays and then compare that with the #mandays needed to be completed as per construction schedule, it will tell you if your project is running on time or not.
Earned value project management is an important method for progress tracking and project controls. You can read more here, on the basics of earned value management along with how to actually calculate the earned value.
Reporting the earned value
Tracking the actual work in terms of timeline and spending is probably the most important aspect of earned value project management.
But once you have successfully gathered the data regarding how different project activities have progressed and what the related costs were, you will need to put all that information that is –
- Easy to understand and communicate
- Provides insights into health of the project
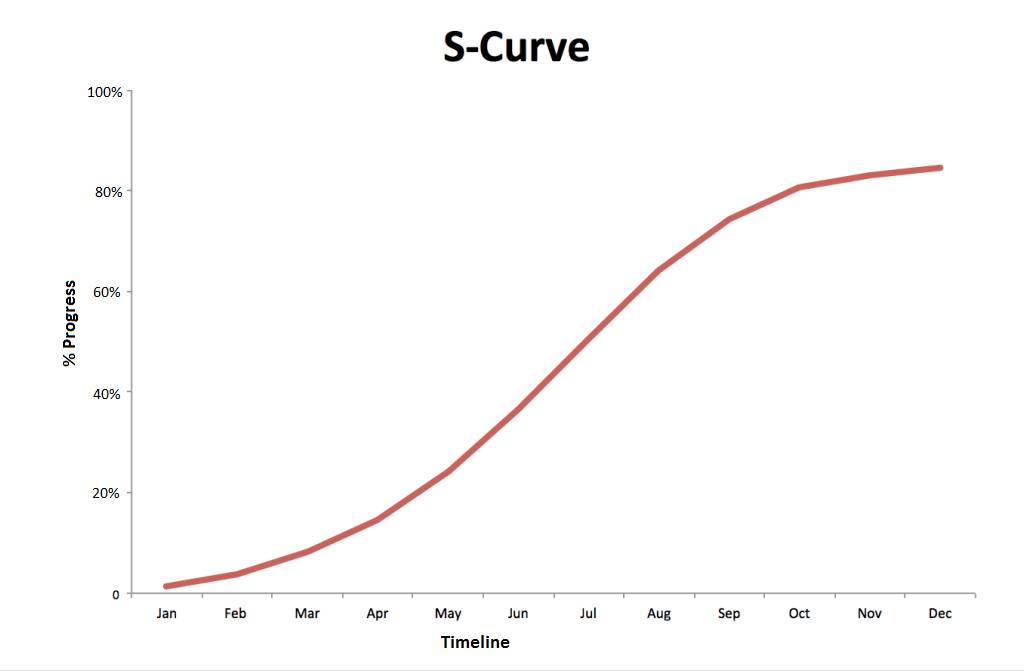
One of the most popular reporting formats for this purpose has been the – S Curve.
S Curve Basics
S Curve is a graphical report plotting the cumulative project of a progress against time.
In other words, you need to follow these steps to generate an S Curve
- Create a project schedule. This will give you a timeline of all project activities.
- Then calculate for each day, how much of work needs to be done – based on the project schedule. For example –
- 4 manhours on day 1
- 12 manhours on day 2
- 18 manhours on day 3 and so on.
- Then calculate the cumulative value of this work against the number of days. From the example above cumulative values would look like –
- 4 manhours on day 1
- 16 manhours on day 2 (4+12)
- 34 manhours on day 3 (4+12+18) and so on.
- Plot the cumulative work against timeline
- The steps above will give you a planned S curve because we have plotted the planned timeline of work from the project schedule.
- If you plan the actual work progress in similar fashion, you will get the actual S Curve
- Similarly, you can plot the actual cumulative spending against timeline to get the actual cost curve.

Understanding the S Curve
The very nature of construction projects is responsible for the S shaped curve for cumulative progress.
For a typical construction project, work starts at a relatively slower pace in the beginning. Then it picks up and most of the work is done in the middle of the project timeline. Afterwards, it gradually slows down and few activities remain towards the end of the project.
Since we are plotting the cumulative value of work to be done against time, the slope of resulting curve represents – rate of work at that point in time.
Hence initially you have a gentle slope, indicating a slower start. Initially the project starts with few activities and gradually you start more activities as time progresses. As the number of activities increases, you are doing more each day and the S curve also starts to get steeper.

Then as the speed of construction work picks up in the middle of the project, so does the slope. In this phase all activities are in full swing, you are getting more things done each day. So the S curve is steepest in the middle.

Afterwards, the slope decreases gradually, indicating that one by one different activities are getting completed. As you have fewer and fewer activities towards the end, there is less amount of work getting done each day.

Automated S Curve Reporting
You can follow steps 1-7 described above, to manually create an S-curve report. But it takes a lot of time and efforts. Especially if you want to update the actual progress against planned S curve, there are a lot of repetitive efforts.
What you can do instead, is automate progress tracking of your engineering & construction project. This can be done easily using an integrated project management platform to connect with your team. Your team will then record their work on the platform, this work is then captured as the project progress data. The software then converts this progress data to a neat, readable S curve report.
The most challenging step however, is to get your team to regularly record their own work on a software platform.
Not to worry though, we still have a solution.
Our team at WorkPack has helped project managers from different verticals of engineering & construction to automate their progress tracking on our integrated project management platform.
WorkPack integrates your project schedule with – emails, document storage, spreadsheets and a workflow engine.

So whenever a document is created, uploaded OR email is sent OR spreadsheet data is updated, this information is captured as progress update and reflected in an auto-generated S Curve report in WorkPack.
In that case you don’t need to ask your team to spend 5 hours each week updating data into a software.
They can just carry on their work and WorkPack will do the tracking and reporting.
But don’t just take our word for it. Sign up to create a free account for your team and check it out for yourself. Let us know if you need any help.
1 Comment
Wong Tin Tiang
April 8, 2020
wish to learn and draw s curve to a project