Recent RERA regulations have made it mandatory for builders and real estate developers to implement stricter project controls for their construction projects.
As a construction project manager, you need to make sure that the project finishes on schedule and within budget. For this, you need to have firm control over project timeline and costs.
Strong control over a project requires clear visibility of how that project is progressing and where it’s heading, just like when you need a clear view of the road when driving your car.
Project managers have long been using ‘Earned Value Management’ and its byproduct – ‘S-Curves’ for monitoring projects. Those same tools are valuable for tracking construction projects as well.
An S Curve report can help a construction manager to track –
- Actual progress timeline against planned schedule
- Actual costs against budgeted costs
- Actual costs against actual progress achieved – this is a measure of productivity
Tracking ground level construction progress data
But creating and regularly updating S-Curves for construction projects is easier said than done. A key challenge is gathering the progress information from construction site for all activities.
On one hand, you can ask your site engineers, construction supervisors to create and send daily progress reports from the site. But creating these reports can take up a lot of their time. They can get distracted from their primary task which is supervising the construction work.
Alternatively, you can empower them with technology. All of them have a mobile device with them on site. These mobile devices (smartphones or tabs) are powerful computers. So why not leverage this technology?
Provide them a mobile app which can help in tracking their day to day work.
For example – at the end of the day, a construction supervisor can go to his mobile app, select what activity his team worked on that day and then report how much of work has been done so far.
WorkPack mobile apps are already helping construction managers to track the ground level construction progress with mobile apps distributed to their teams.
![]()
When you have many supervisors tracking different construction activities, it is easier for them to simply enter a few numbers on their mobile phones at the end of a workday. These numbers are then communicated to a central server. WorkPack reporting module puts all these numbers together to prepare the S Curve report.
In absence of a central progress tracking platform like WorkPack, a construction manager would need to get all the progress information from individual site supervisors, put it in a spreadsheet and then prepare a report. All this time and back n forth communication can be easily saved with a little help from mobile apps.
Multiple mobile based forms
Normally you have a variety of different activities in a construction project. The nature of these activities can vary widely. Similarly, their units and progress inputs also vary.
So you cannot have a single standard mobile based form where your construction team can input details of the different kinds of construction work that they are doing.
Instead, you will need a system which allows you to create multiple forms for different types of construction work tracking.
You can also create another set of mobile forms for material and cost tracking. This second set of forms will be given to the store managers.
WorkPack allows you to configure multiple mobile based forms for data entry. Further, you can also decide what kind of information should be captured in these different forms – ranging from images, text, numbers, checklists etc.
This gives you the capability to track all kinds of information about – construction, commissioning and logistics activities.
Next, we can look at how all this information fits in an S Curve.
Creating and Understanding S Curve
S curve is a graphical report for the cumulative progress of a project.
Before the project begins, a planned S Curve can be prepared based on the project schedule. First, a timeline for each project activity is determined. This represents the cumulative progress of that activity against time. Then a weighted average of the progress of all activities is calculated against timeline. When these cumulative progress values are plotted as a curve against time, you have a planned S Curve.
You can read more here to understand the basics of S-Curve.
When the project starts, you can use the actual cumulative progress data instead of planned progress to plot an – S Curve for actual project progress. It is represented by the green curve in the following image.
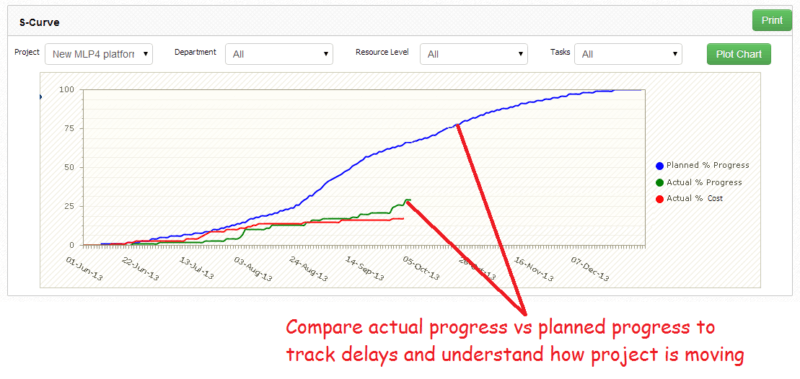
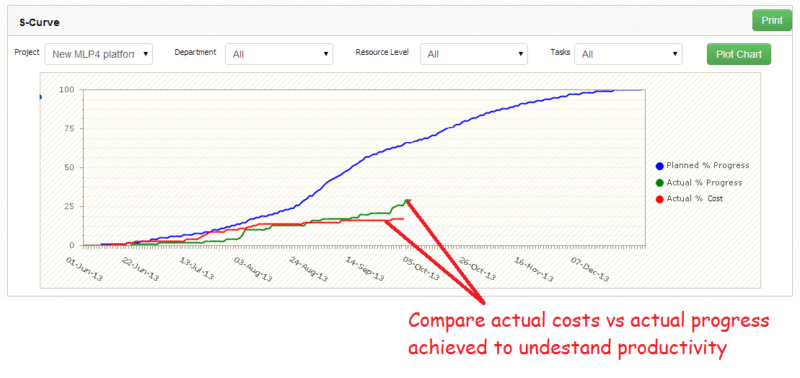
Further, you can also track project related spending and plot the cumulative values of these costs against time to plot – S Curve for actual project costs. It is represented by the red curve in the following image.
You can then compare the actual S Curves for progress and costs against the planned S Curve to understand –
- Actual progress against planned progress
- Actual costs against budget
- Actual costs against actual progress achieved – a measure of productivity
Note that you will need to plot the S Curve in terms of % values in order to compare costs against progress since they have different units for their original values.
Also, note that progress and cost values overlap in the planned S Curve. This is due to the assumption that in ideal conditions costs will be proportional to progress achieved.
S Curves in WorkPack
Using these principles, WorkPack first creates a planned S Curve when a project schedule is created.
When the project work begins, construction team sends in progress updates from mobile apps. This progress data gets updated in WorkPack server and immediately reflected in an S Curve report in WorkPack.
So at any time, you can visit S Curve report on WorkPack to understand where your construction project is presently standing in terms of progress, costs and productivity (or profitability).
This will give you real time visibility of how your project is progressing and where it’s headed. You can then exercise firm control over those projects, which is now made mandatory by RERA regulations.
WorkPack S Curves have already helped project managers and construction managers from different industries.
Create a free account on WorkPack to understand how they can help your construction team as well.
Let us know in case you want to schedule an online demo for your team or if you need any help to set up a free account.
1 Comment
Anass
November 27, 2019
Interested to have the app for project management and S curve generation
With cost control